Skip to content

Selected work

Selected projects, with where they started and what changed.

Each one says what the client came to us with and which number moved by the end, and there are very few screenshots. Where something didn't go to plan, that's in there too.
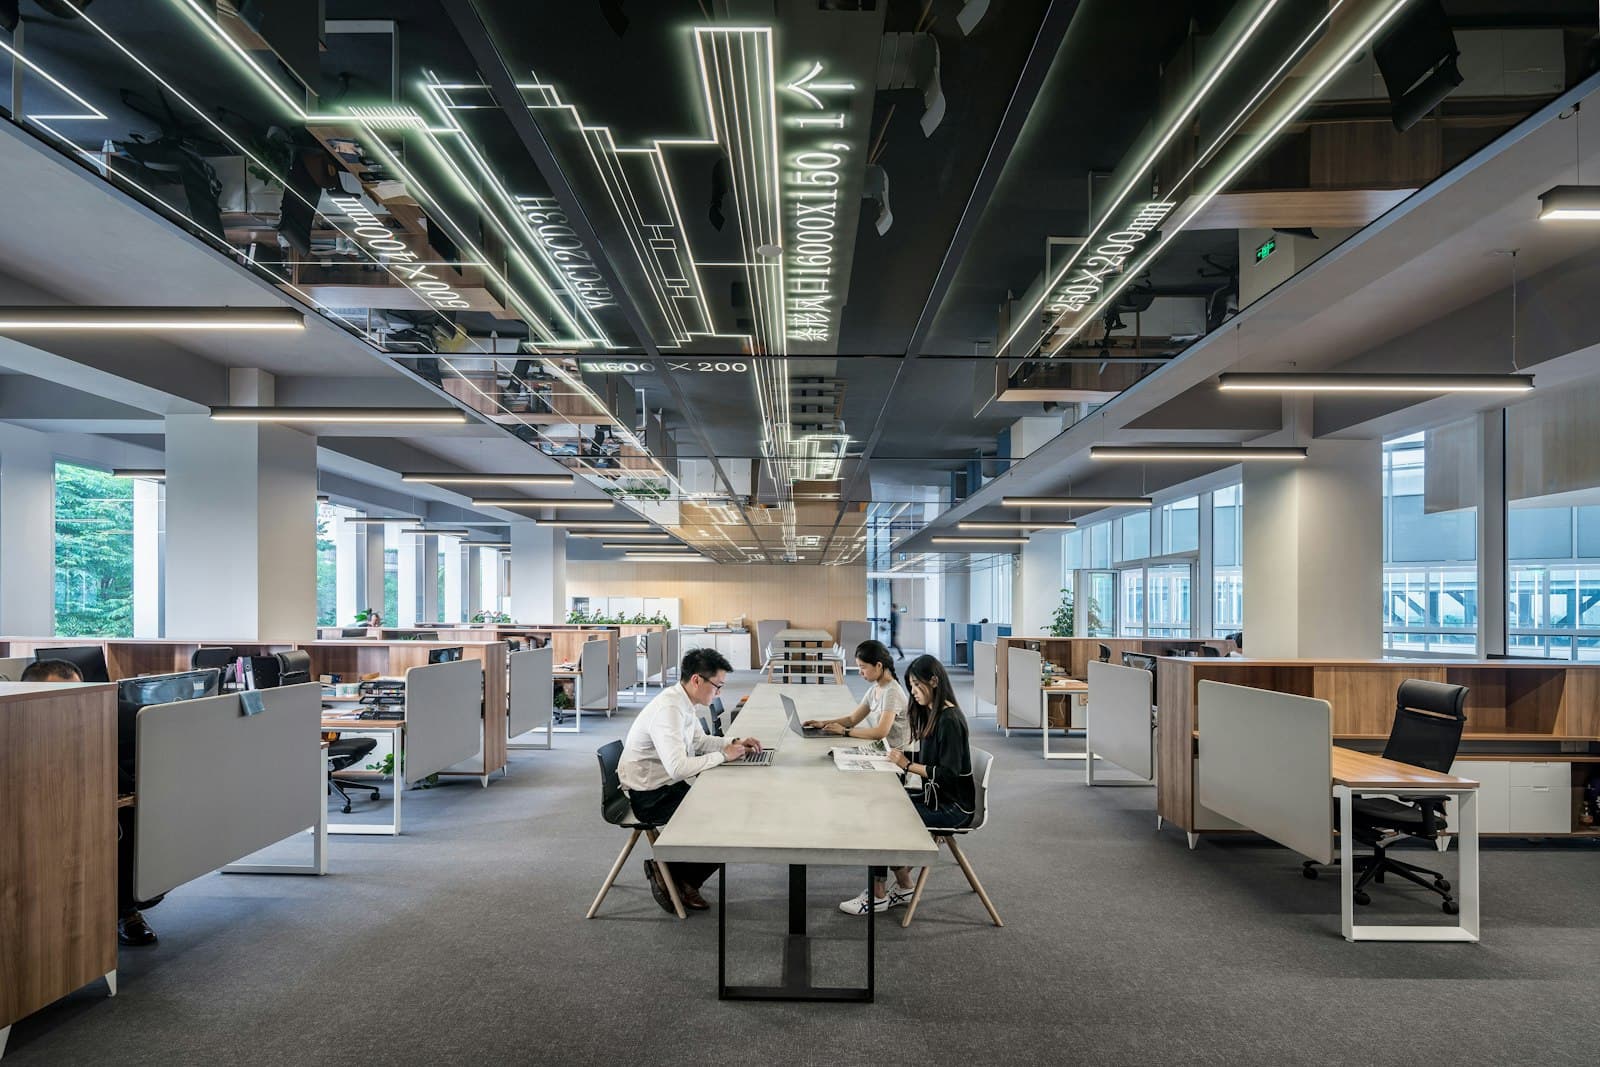
A wide open-plan office with people at work

Case studies marked Sample are illustrative engagements with anonymised, representative details. Replace them in src/content/case-studies as real client work is approved for publication.

Logistics & Supply ChainSample

Replacing a 15-year-old dispatch system without stopping the trucks

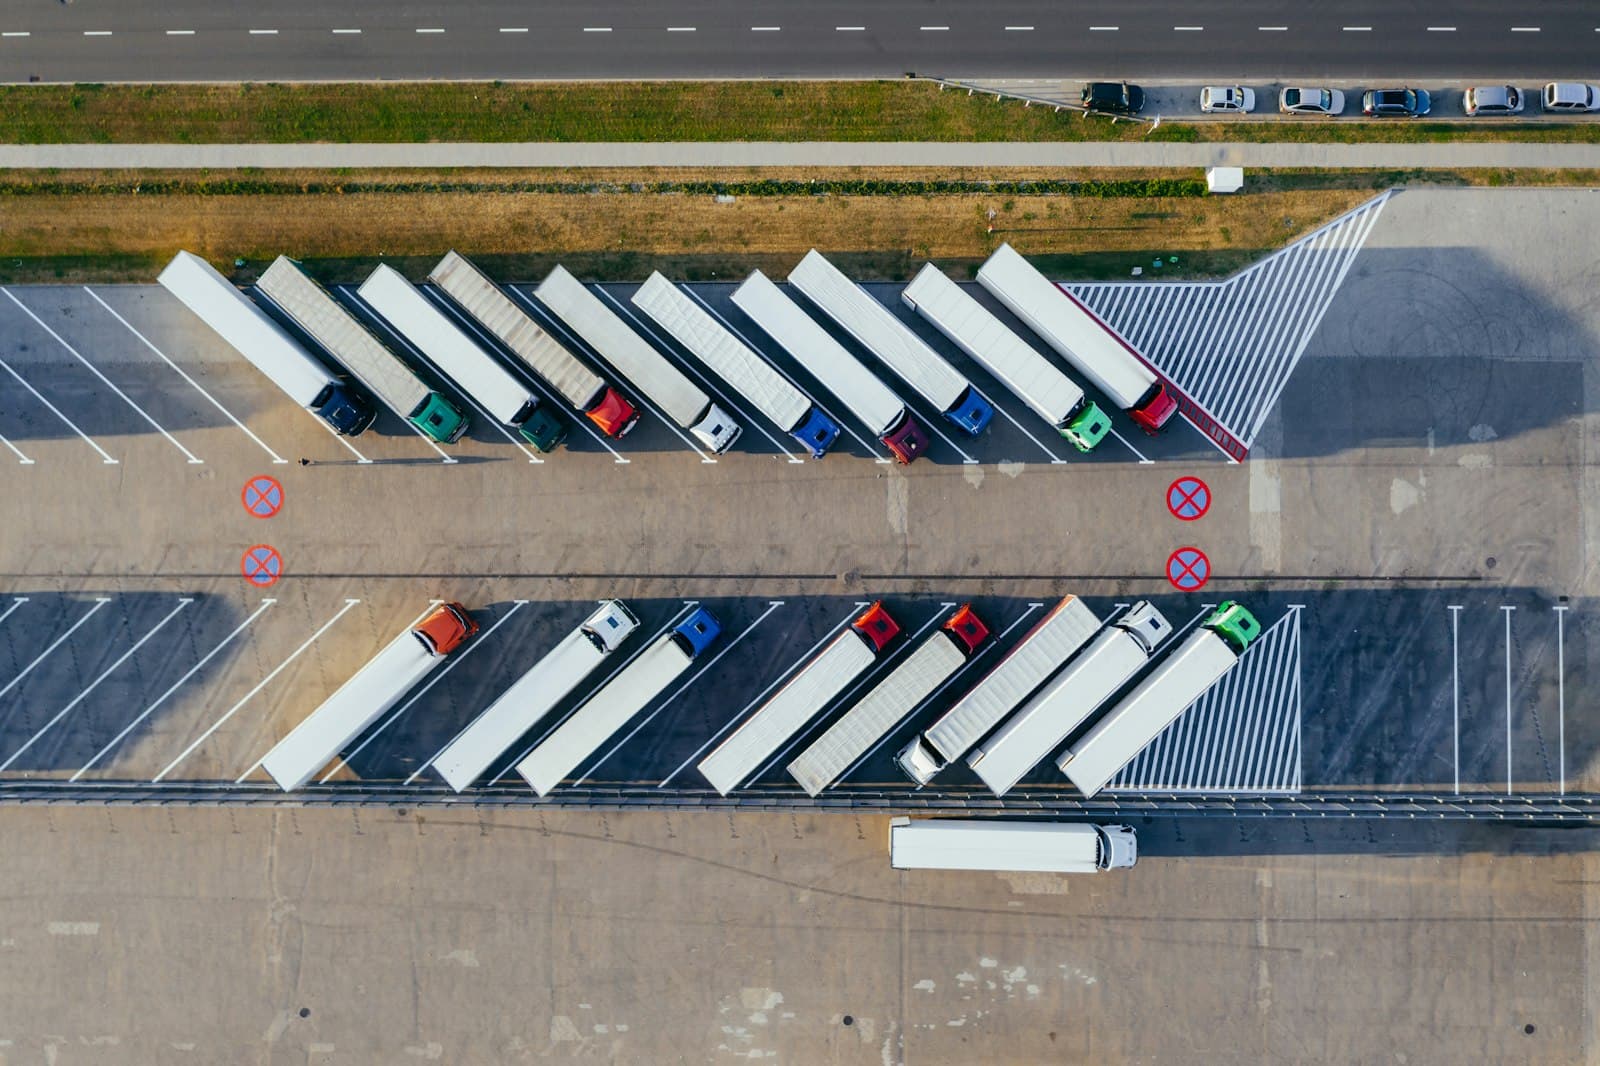
A regional carrier running 180 vehicles depended on a desktop dispatch system built in 2009. Planning was done by hand and driver updates came in by phone. The vendor had stopped supporting the product. We replaced it with a web planning board and a driver app, one workflow at a time, while the operation kept running.

hours of operational downtime during cut-over
0
hours of operational downtime during cut-over
fewer inbound 'where is my delivery' calls
38%
fewer inbound 'where is my delivery' calls
saved per planner, per day
2.5 hrs
saved per planner, per day
Read the case study
Aerial view of lorries parked in neat rows at a distribution depot

How we measure

We pick the number before we write any code.

It might be hours saved, calls the planners no longer make, time to a lending decision, cost per order or uptime. We agree it in discovery and wire up the measurement in the first sprint. After that it goes in every report, including when it moves less than we hoped.